Think of it this way, if you have $10 in your pocket and an item costs $10 you can afford to purchase one unit of the item. But if the price is $5 you can afford to buy 2, and if price is $2.50 you can purchase 4, etc.
Further, since there are more middle and lower income people than rich people, the lower the price the greater the number of people who will be able to afford to buy the product and the more people able to afford the product the greater the quantity that will be demanded.
Supply Curve – shows quantities of a good supplied at various prices. The higher the price the greater the quantity supplied.
No business (supplier of a product or service) can afford to sell at a price lower than cost and remain in business. BUT all suppliers of a good do not face the same set of costs. A farmer with fertile soil, a good climate and sufficient rain can produce a larger crop, at a lower cost than a farmer growing the same crop in poor soil in the desert. The desert farmer incurs the same costs for seed, labor, etc. as the other farmer. But the desert farmer must also purchase fertilizer, install irrigation and pay for water. As a result, the desert farmer will have higher costs per bushel of product than the farmer in the ideal location. In order to make a profit on his crop, the desert farmer has to receive a higher price per bushel than the other farmer. The point is that producers of a good or service face different circumstances and some are able to produce at a lower cost (require fewer resources) than others. As the price of a good rises more producers are able to offer the good or service.
As a second example, consider yourself and the sale of your labor services. If you had tickets to a concert for tonight and your supervisor asked for a volunteer to work overtime at the regular hourly rate you probably would not volunteer. If double time was offered, you might be tempted but the desire to see the concert would probably be greater. But, if your supervisor offered a $1,000 bonus to put in an additional four hours this evening, doing your regular work, you would probably take the offer. As the price goes up you, as the seller of your labor services, are more inclined to increase the quantity of labor you are willing to provide. In this example the cost is your opportunity cost. If you earn $10 per hour and your concert ticket cost $50 the decision to volunteer or not is a no brainer since you will lose the $50 spent on the ticket and only gain $40 from working the four hours. If your supervisor offered you double time (i.e., $20 per hour) for the extra four hours you would earn $80 and lose $50 for a net gain of $30. More than likely the desire to see the concert would be greater than the $30 of additional net income so you would probably still turn down the extra work. But $1,000 or $250 per hour, for four hours of work would probably change the equation as the opportunity cost of giving up the extra pay ($1,000) dwarfs the $50 plus satisfaction of attending the concert.
In summary, the demand curve shows the various quantities of a good that will be demanded (i.e., consumers are willing and able to buy) at various prices, while the supply curve shows the various quantities of a good that will be supplied (offered for sale by producers) at various prices. The point where the two intersect is the point where the quantity demanded equals the quantity supplied and this is the equilibrium or market price.

Equilibrium
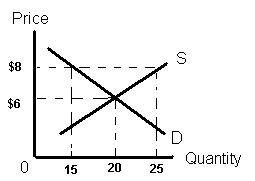
Question: "If the equilibrium price of a product were $6 and the actual price charged in the market were $8, you would expect?"
Answer: There will be a surplus or excess of product on the market since the quantity demanded by buyers will be less than the quantity supplied by sellers.

In the graph above, consumers only want to purchase 15 units of the good at $8, while sellers want to sell 25 units at that price. We have a surplus, or overstock, of 10 units (25 available for sale minus the 15 people are willing to buy). Since sellers are in business to get money, they will compete to get rid of their merchandise and the best way to lure a buyer from a neighboring store is to offer the identical product at a lower price. Each will begin lowering their prices until all of the product is sold. Sellers who were forced to sell below cost will drop out of the market (or at least drop that product line) so long as the price is below the $8 which brought them into the market. The market will then stabilize at $6 which is the price at which the quantity supplied equals the quantity demanded.
Question: "A decrease in equilibrium price and quantity in a market will be caused by?
Answer: Both the supply curve and demand curve show how quantity demanded or supplied changes as price changes with all other influencing factors being held constant. But you and I know that price is not the sole factor in determining what and how much we buy or how we choose to sell our labor or any other product we may have.
The other Determinants of Demand are:
1 Consumer Tastes
2 Income level of consumers
3 Size of population (or number of consumers in market)
4 Prices of other goods, specifically substitutes (goods that can be used in place of the good in question such as buying lower priced chicken in place of steak) and compliments (good used in conjunction with another good such as hamburger buns and hamburgers).
The other Determinants of Supply are:
1 Technology
2 Input prices (the cost of the inputs, such as labor, raw materials, etc., used in the production of the product in question).
In constructing the two graphs used above, we assumed that the other determinants of demand and supply, listed above, remained constant while only price changed. However, these other determinants can, and do, change. When they change the result is a shift in the supply or demand curve.
For instance, the question "A decrease in equilibrium price and quantity in a market would be caused by?" can be answered by a change in one of the determinants of demand such as:
1 Taste – if consumers become concerned about the increased risk of injury and death posed by compact cars they will change their tastes or preferences for compact cars and many will switch to larger vehicles which they perceive as being safer.
2 Income Levels – if wages in Tucson drop across the board, local consumers will have less money to spend and they will want less of a product at every price.
3 Size of Population – if the Air Force decides to consolidate the functions of DMAFB with those of another base in another state and move all of the personal from DMAFB to the other state the population of Tucson will drop and so will the number of homes/apartments needed to house the remaining population. In this case fewer homes/apartments will be demanded at every price.
4 Prices of Other Goods – if the price of chicken at KFC, Church's Chicken, etc. drops while the price of hamburgers at MacDonalds, Burger King, etc. remain the same, many people will switch from hamburgers and substitute the lower priced chicken causing the quantity demanded of hamburgers to be less at every price.
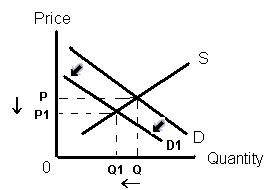
In each of the scenarios above, a change in one or more of the other determinants of demand results in the entire demand curve shifting to the left and intersecting the supply curve at a new point where both the price and quantity are lower.

As you can see in the graph above, the demand curve has shifted to the left, from D to D1, the equilibrium price has dropped from P to P1 and equilibrium quantity dropped from Q to Q1.
If the opposite happens in any of the above determinants of demand (i.e., tastes change in favor of the product, incomes go up, population increases or prices of other substitute goods increase - i.e., prices at chicken fast food restaurants increase but those at hamburger restaurants don't, making hamburgers relatively cheaper than chicken offerings) then the demand curve will shift to the right signifying that greater quantities are demanded at each price.
Further, if one or more of the determinants of supply increase, that curve will shift. An advance in technology that results in reducing the cost of production (such as a new process for making steel from iron ore that results in a reduction in the cost of producing steel – this will lower the cost of steel thereby reducing the cost of producing things like cars which use a lot of steel). This will cause the supply curve for cars to shift to the right showing a larger quantity supplied at every price. Similarly, a drop in the price of oil will result in lower fuel costs for airlines and this means that the cost of flying airplanes will be lower. This would shift the supply curve for air travel to the right showing increased quantity (i.e., more flights) at every price. BUT, if the price of oil increases, this will raise the cost of flying airplanes causing the supply curve for air travel to shift to the LEFT indicating fewer flights (lower quantity) at each price.


No comments:
Post a Comment